
Designing data platforms translating complex public datasets into actionable insights for government programs
I contributed to the BigData Ceará initiative, a government-driven project focused on improving data transparency and accessibility. My work involved designing dashboards and data visualization frameworks to help decision-makers interpret large-scale public datasets related to health, education, and infrastructure. The challenge was balancing analytical depth with accessibility and usability for diverse stakeholder profiles, from policymakers to technical analysts.
Bureaucracy buried insights in data silos
Government secretariats in Ceará managed massive volumes of data across health, education, and financial sectors, each stored in separate physical locations with their own protocols. Analysts needed weeks to consolidate datasets because requesting access required navigating bureaucratic procedures between departments. Beyond access challenges, the data itself suffered from inconsistencies, spelling errors, duplicate records, and format variations that made meaningful analysis nearly impossible.
These scattered datasets contained implicit relationships that could drive better public policy decisions and enable scientific research benefiting the population. A school attendance database combined with hospital admission records could reveal which students missed classes due to health issues. Tax data crossed with health expenditures could identify regional investment priorities. But without centralized infrastructure, these insights remained locked away.
I joined a research team from Universidade de Fortaleza partnering with the state government to build BigDataCE, a web portal designed to eliminate manual data reconciliation and create a single source of truth for government data.
Understanding workflows through user research
Before designing, I needed to understand who would use this system and how. I conducted semi-structured interviews with government employees who worked with these databases daily. These conversations revealed three distinct user profiles with different needs and responsibilities.
The ETL Process Managers would oversee the entire data transformation pipeline. The Data Managers from each secretariat would upload datasets periodically, maintain data dictionaries, and grant access permissions. The Data Analysts would request access to specific datasets, perform analyses using BI tools within the platform, and leverage computational resources for processing large volumes.
Later on, these insights were documented into personas and mapped complete user journeys using UML diagrams. This visualization made it clear where friction existed: unclear what data was required versus optional, no visibility into whether files contained errors before processing, confusion about how datasets could be combined.
Progressive disclosure for complex processes
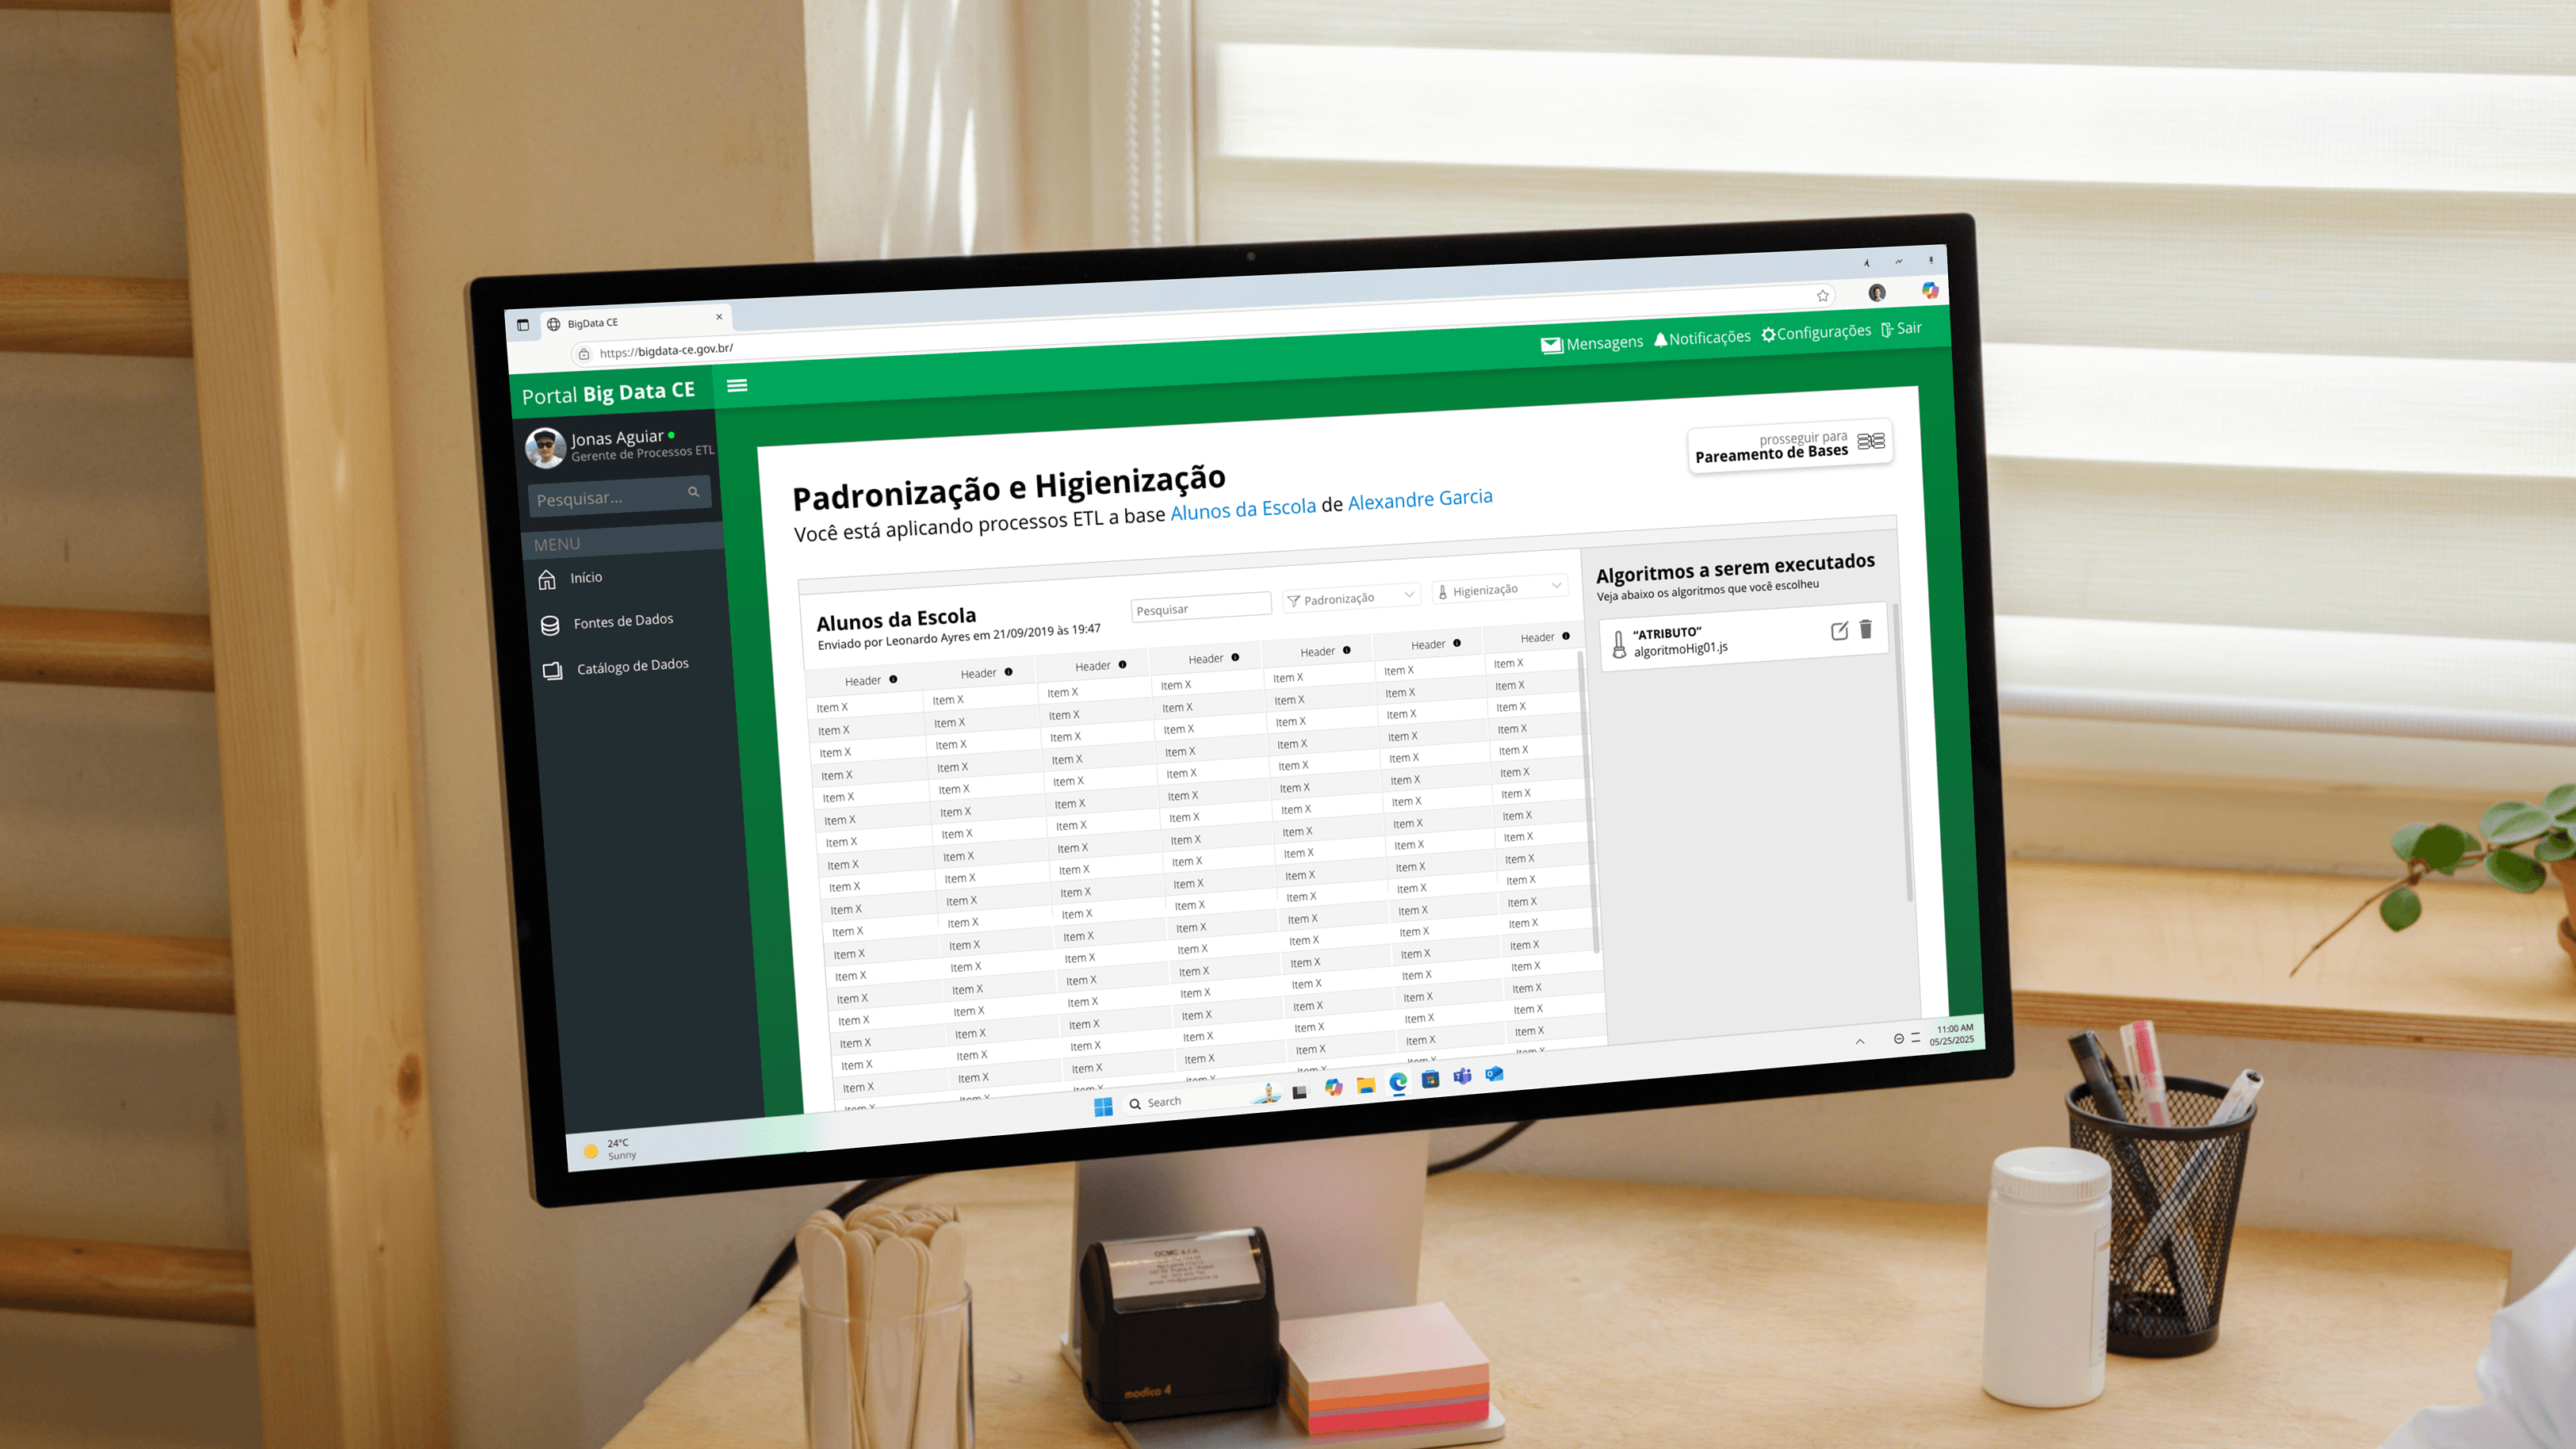
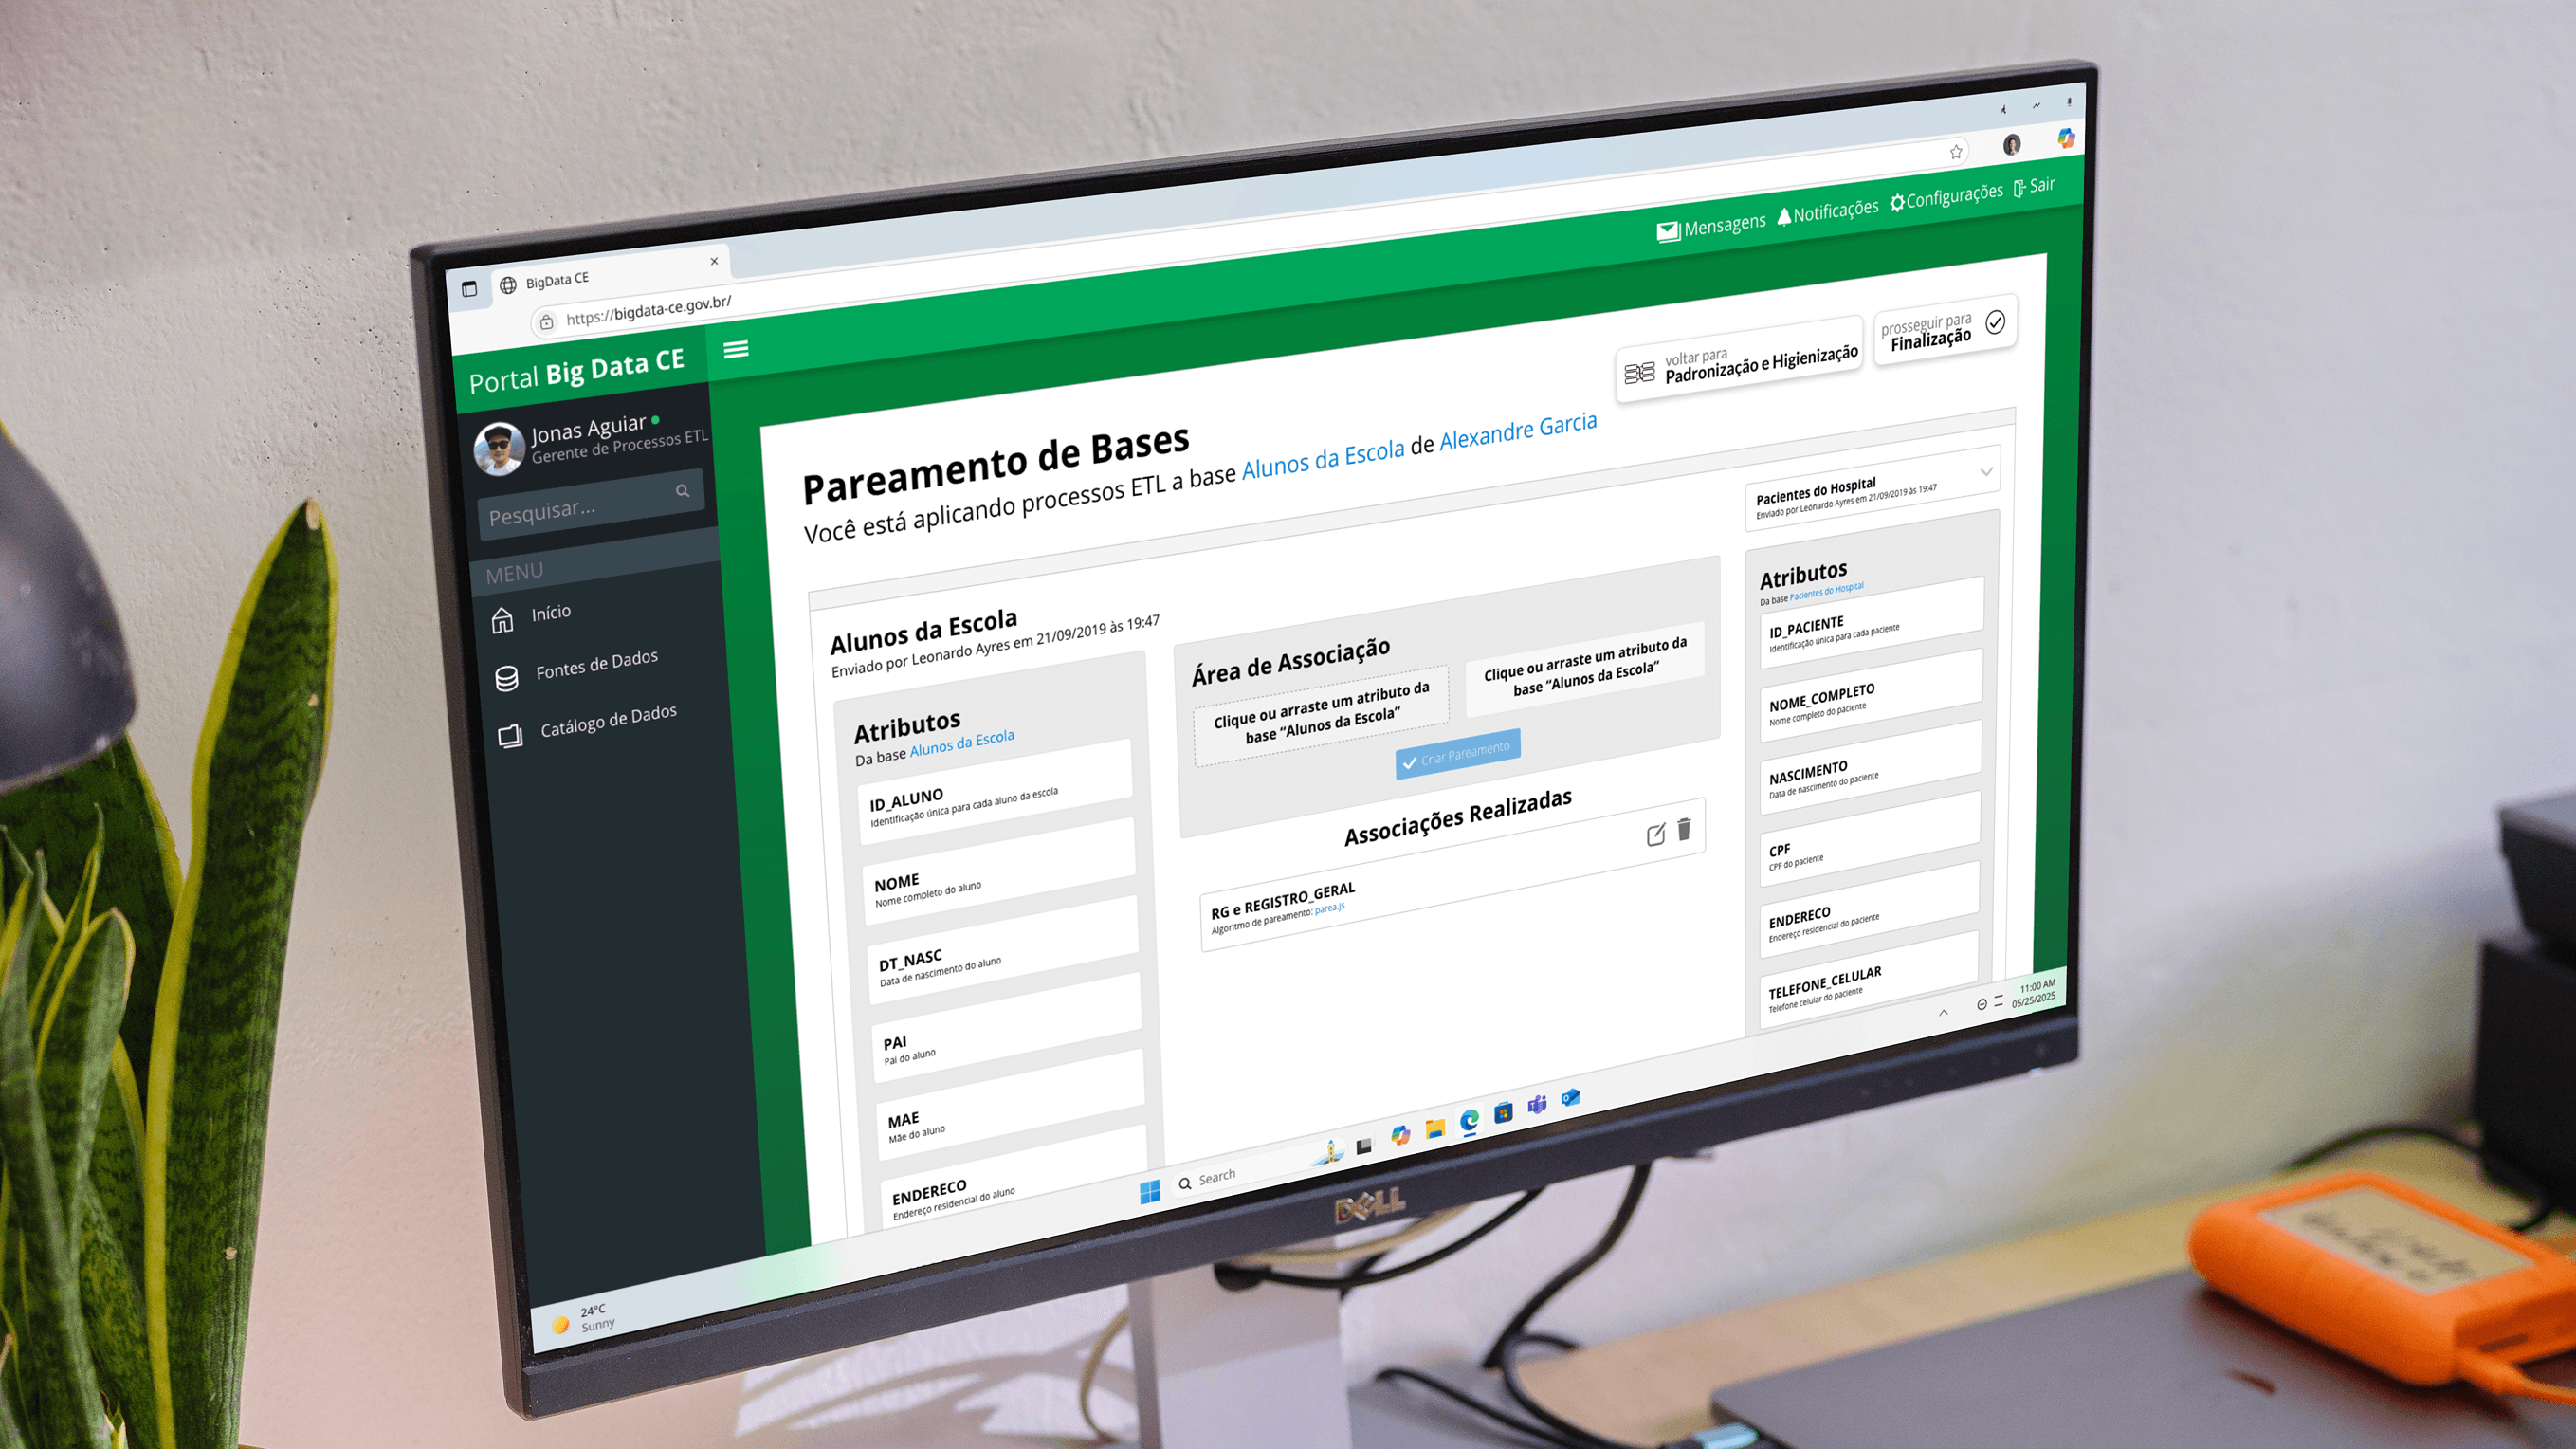
The platform needed to handle ETL operations (Extract, Transform, Load) that involved three critical processes. Standardization established consistent formats across equivalent fields in different databases (date formats, address structures, naming conventions). Data cleaning removed test records, corrected abbreviations, stripped accents, and eliminated duplicates. Record matching identified equivalent entries across multiple databases using similarity algorithms.
Each of these three processes derived a interface specificly made to deal with each ETL operation. Starting with standardization,
Designed interface architecture that revealed complexity progressively. Primary workflow showed essential actions: upload datasets, select target secretariats for pairing, review data dictionaries, configure matching parameters. Advanced features for edge cases stayed accessible but not prominent. This approach kept routine tasks straightforward while maintaining power for sophisticated analysis.
From scattered files to semantic data lake
Architected the information flow around AWS infrastructure. Built data lake using S3 storage to centralize all government datasets, primarily CSV files from different sources. Used AWS Glue for ETL automation, metadata cataloging, and schema inference through crawlers. The frontend used Angular 7 with PrimeNG components for consistent UI patterns. Backend leveraged Spring Boot and Flask for API development and integration with AWS services.
Created workflows where Data Managers could import files with validation feedback before applying changes system-wide. Analysts could request specific attribute combinations across datasets, submit processing jobs, and receive results without manual file transfers between departments. ETL Managers monitored pipeline health and authorized cross-secretariat data pairing.
High-fidelity prototypes validated before development
Generated wireframes and high-fidelity mockups showing the complete platform experience. Prototypes demonstrated file upload with progress indicators, data dictionary management, pairing configuration with preview of matched records, and results dashboards showing insights from combined datasets. Each screen prioritized critical information: validation errors surfaced immediately, matching confidence scores displayed prominently, processing status visible throughout operations.
Result and automation impact
Transformed weeks-long manual data consolidation into automated processes taking hours. Government analysts gained ability to cross-reference datasets that were previously isolated, enabling data-driven policy decisions. The platform reduced bureaucratic overhead, minimized human error in data reconciliation, and created infrastructure supporting both operational efficiency and scientific research. This centralized system became foundation for evidence-based governance across Ceará state secretariats.